Example maps
Open a map to edit it in Marches, or download an export for a paper, presentation, or social post. The examples include Nevada’s changing boundaries, proposed plague connections, pilgrimage sites, and a fictional campaign.
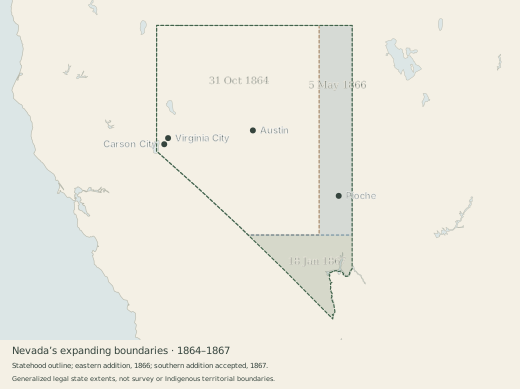
Nevada grows, 1864–1867
Nevada at statehood, its eastern expansion in 1866, and its southern addition in 1867. Colored bands distinguish the additions; the outlines show the three legal state extents.
Sources and scope
Independently reconstructed from public-domain legal descriptions and federal geographic data. Generalized modern fixed edges and river geography are used; this is not a survey reconstruction. These are legal state boundaries, not Indigenous territorial boundaries. Town markers are geographic reference points, not a reconstruction of their historical extent.
Evidence: 1864 enabling act, section 2; federal act of 5 May 1866; Nevada’s acceptance, 18 January 1867. Source notes travel with the editable project.
The western campaign, 1648
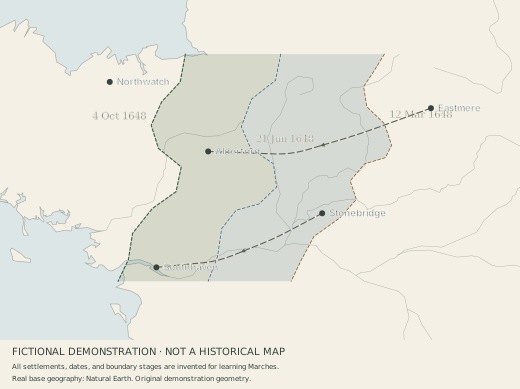
A fictional demonstration of dated stages and shading: three stages of an imagined advance toward the coast. Compare March, June, and October, toggle the shading, or open the example in Marches to adjust a line and shape a shaded edge.
Sources and scope
All settlements, dates, boundary positions, and movements are fictional. The coastline and base geography use Natural Earth data.
Follow a branching network
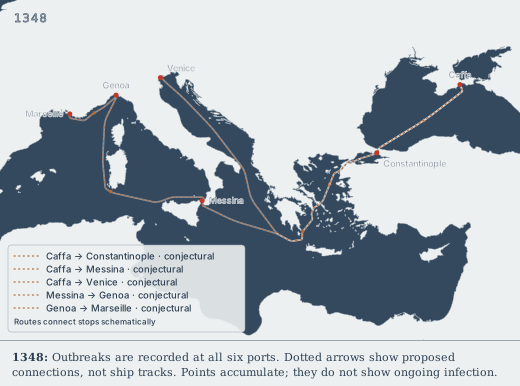
Compare proposed plague connections between six ports in 1346–1348. Use Routes → Connect places to choose a starting place and several destinations. Each branch can have its own dates, source, color, and certainty. Select a route and choose Adjust path to add or move its bends.
Sources and scope
This is a sourced teaching example, not a complete reconstruction of the pandemic. Dotted arrows are conjectural connections. Waypoints guide the lines through waterways; they do not reconstruct exact voyages, and intermediate ports are omitted. Dates mark the selected outbreak chronology, including Venice in 1348 after ship arrivals in 1347. Places and connections stay visible afterward to build a cumulative picture, not to show continuing infection. Markers use approximate modern city coordinates and modern coastlines.
The project and playable map include individual source notes. The main reconstruction follows Bianucci et al. (2017); Venice’s recorded outbreak year follows Bauch & Büntgen (2025). Chronologies and transmission hypotheses remain debated.
A map for the page
A still image of one moment: places visible in 1170, with a year label. Use PNG in slides and documents, or SVG for a scalable figure you can edit.
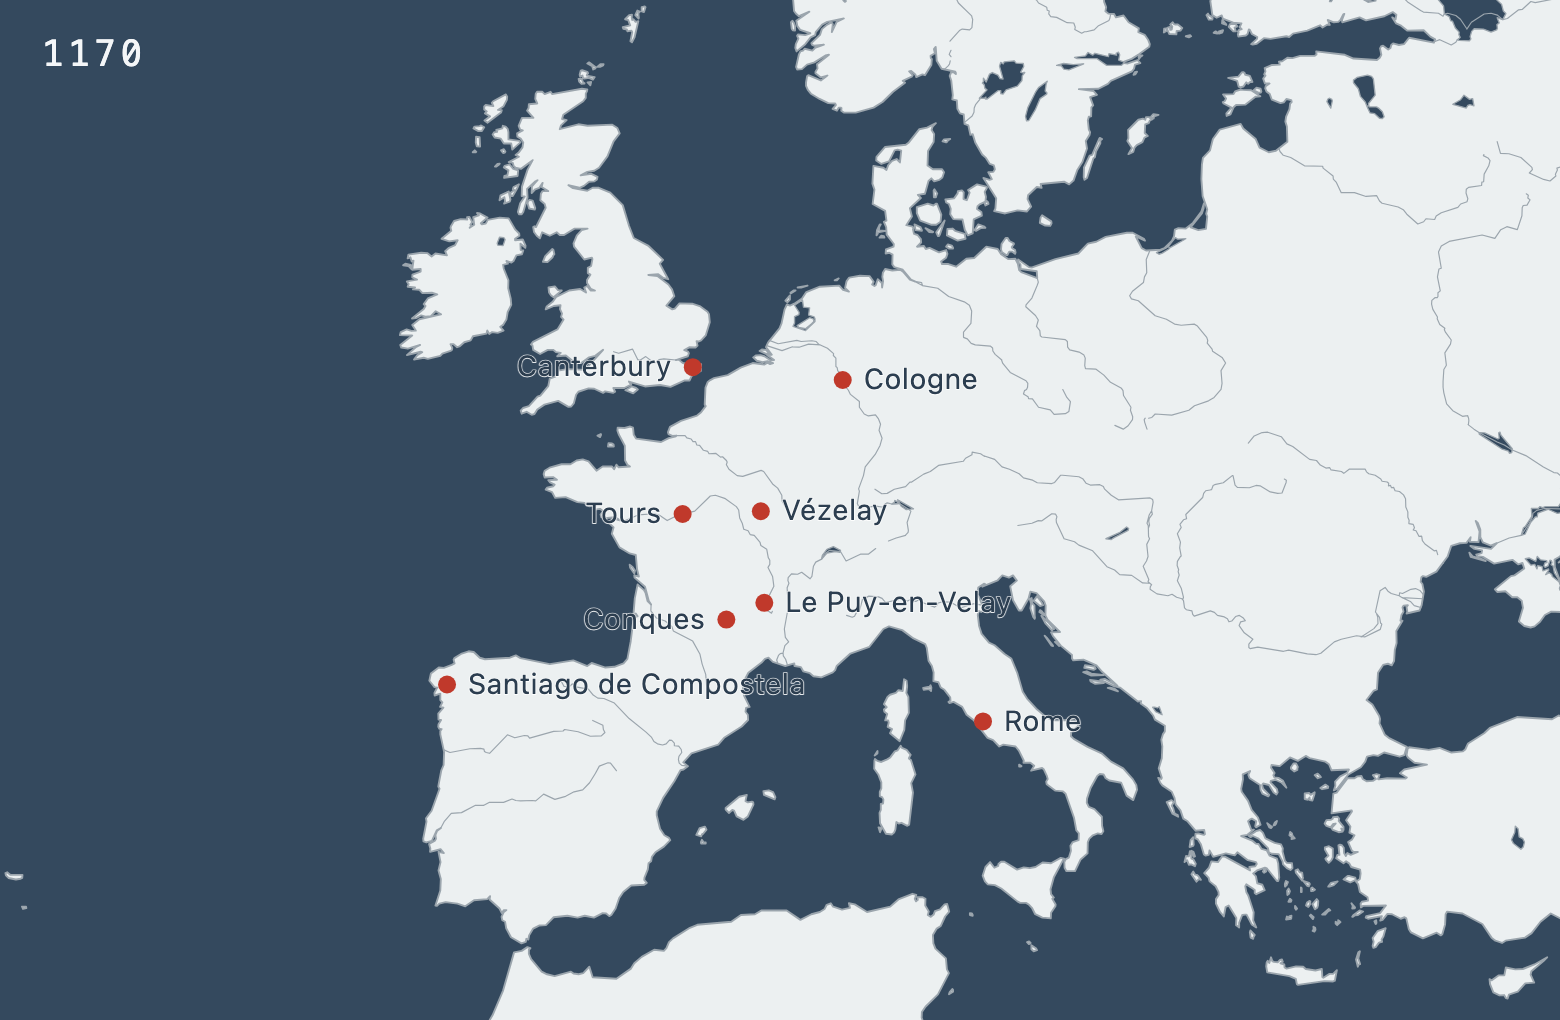
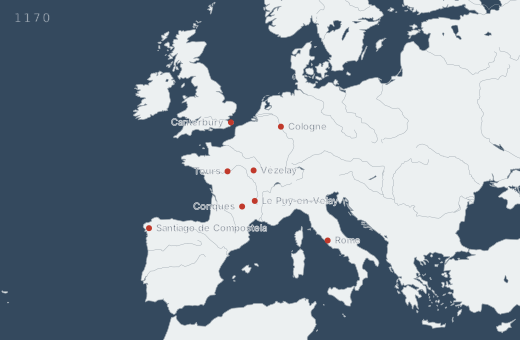
PNG: 1560 × 1020 pixels.
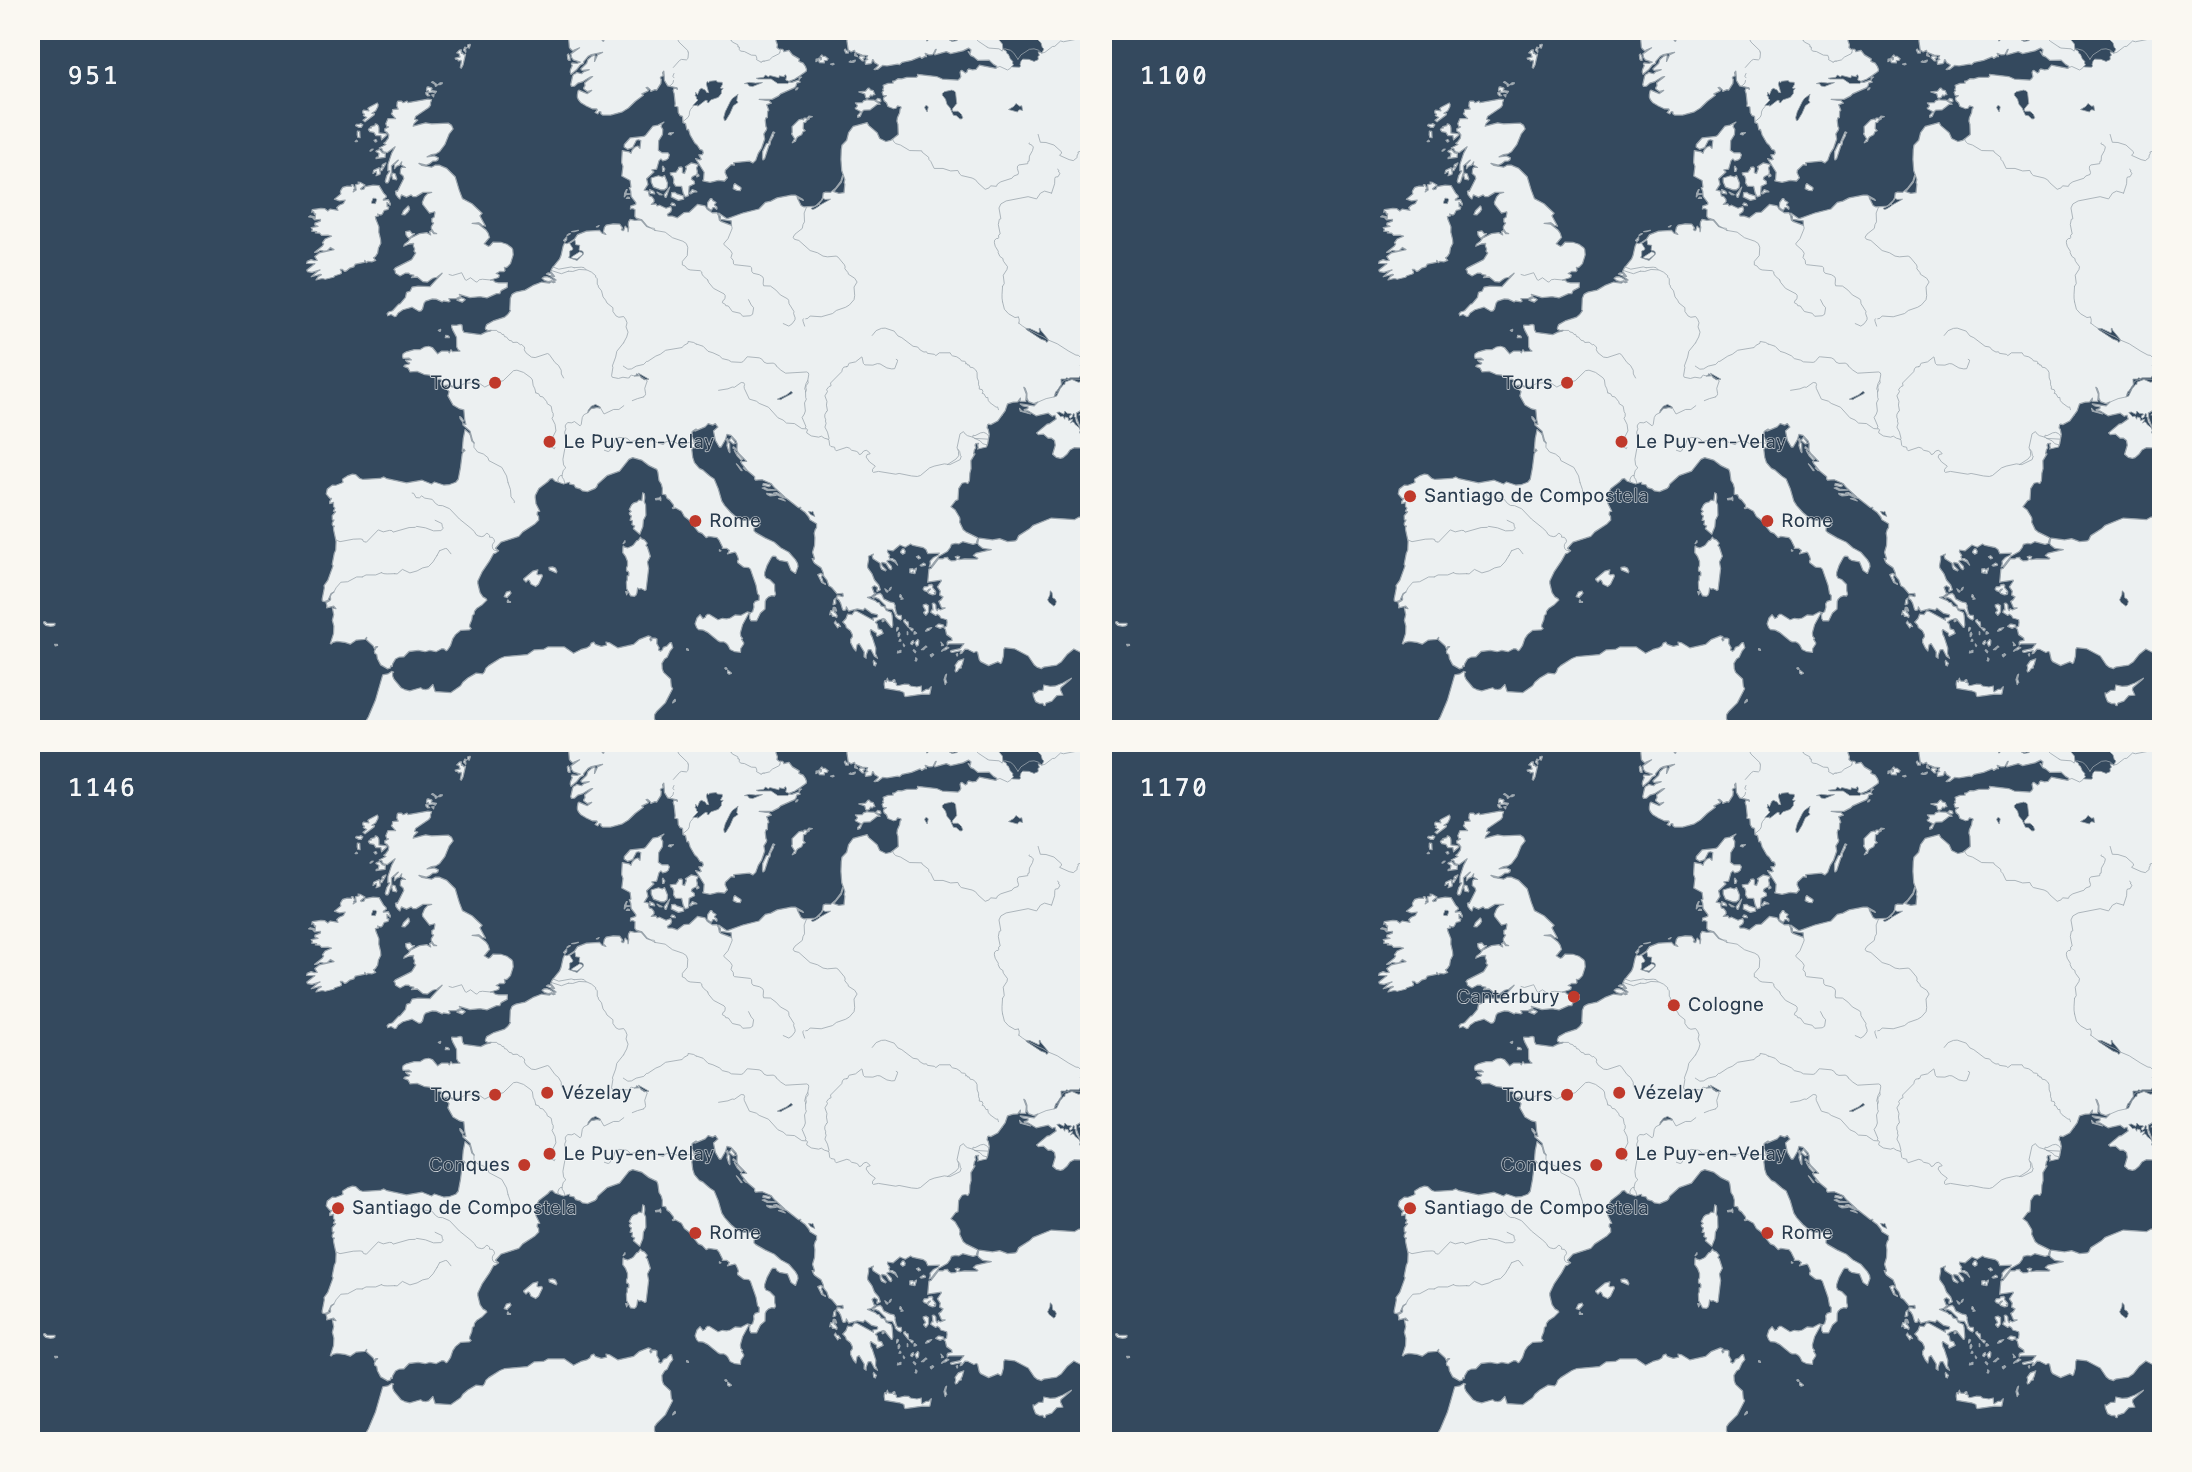
Four years, one figure
951, 1100, 1146, and 1170 sit side by side in one still image, with the same view and scale. Compare them on a printed page, or use individual frames across a slide deck.
Four years, one carousel
A social carousel tells the story in slides. Each portrait slide has a year, a short caption, and a timeline strip. The view stays fixed as places appear. This example uses Blue, from the Monochromatic palette section.
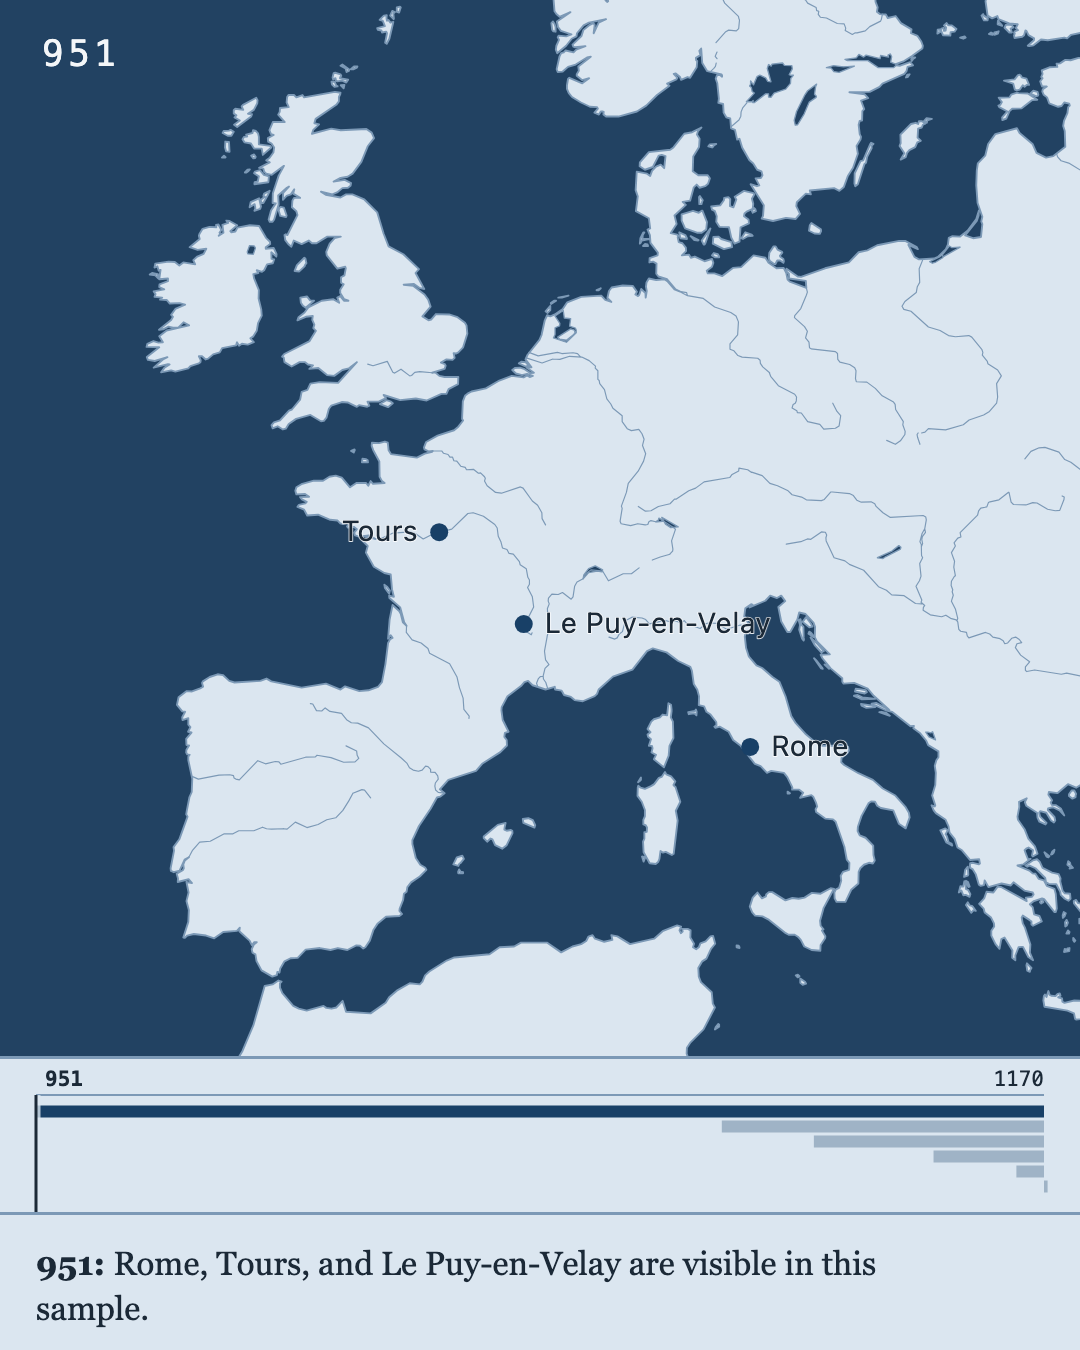
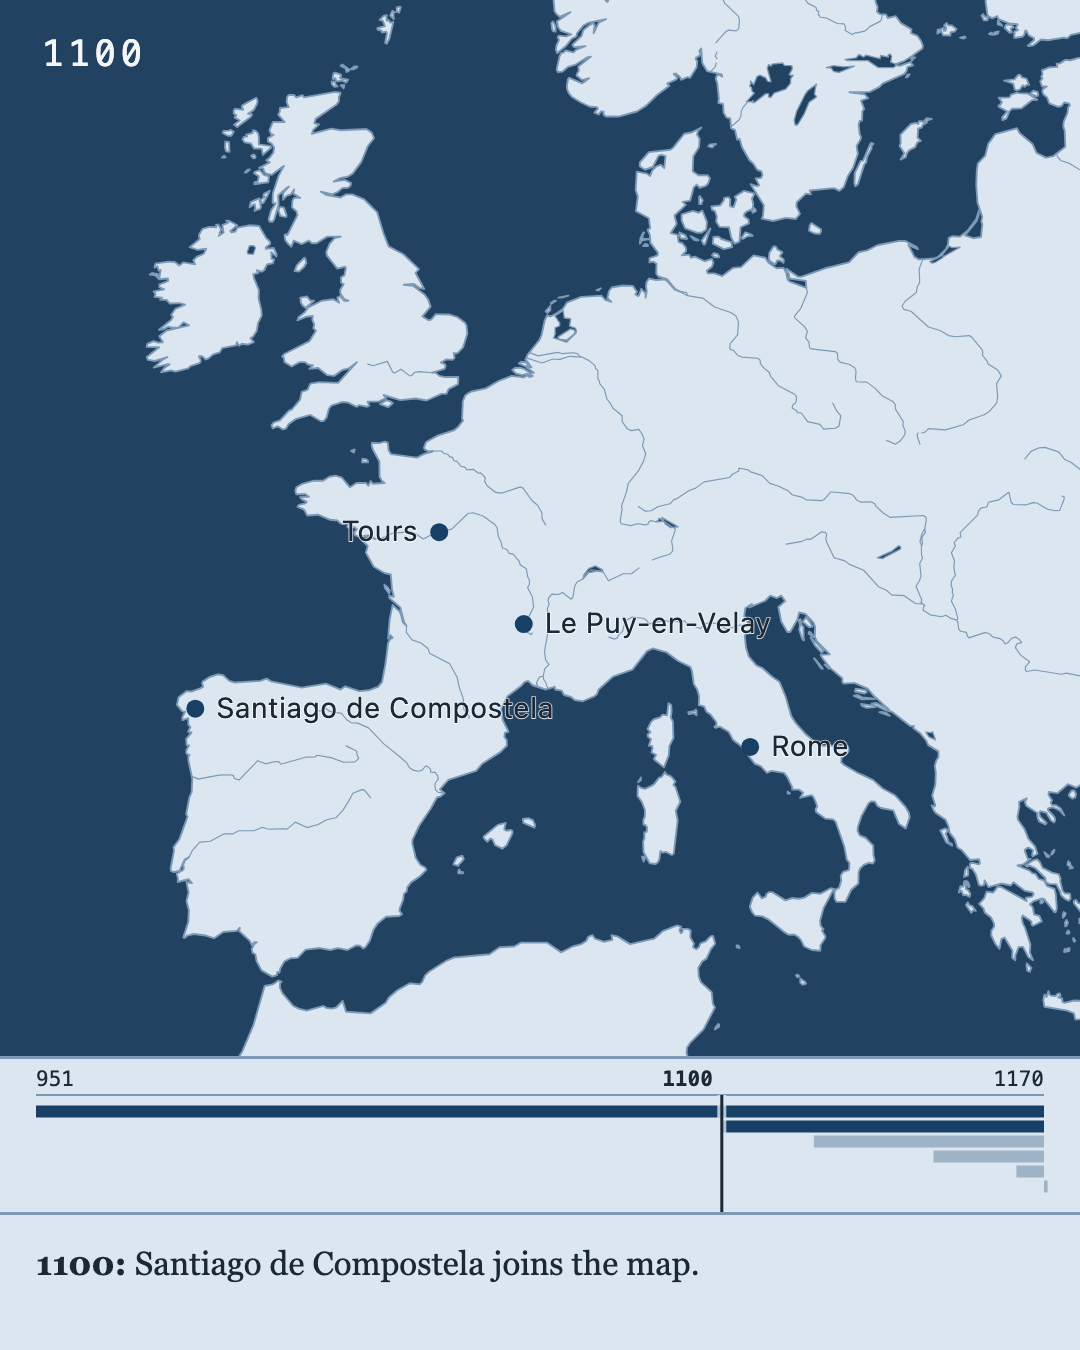
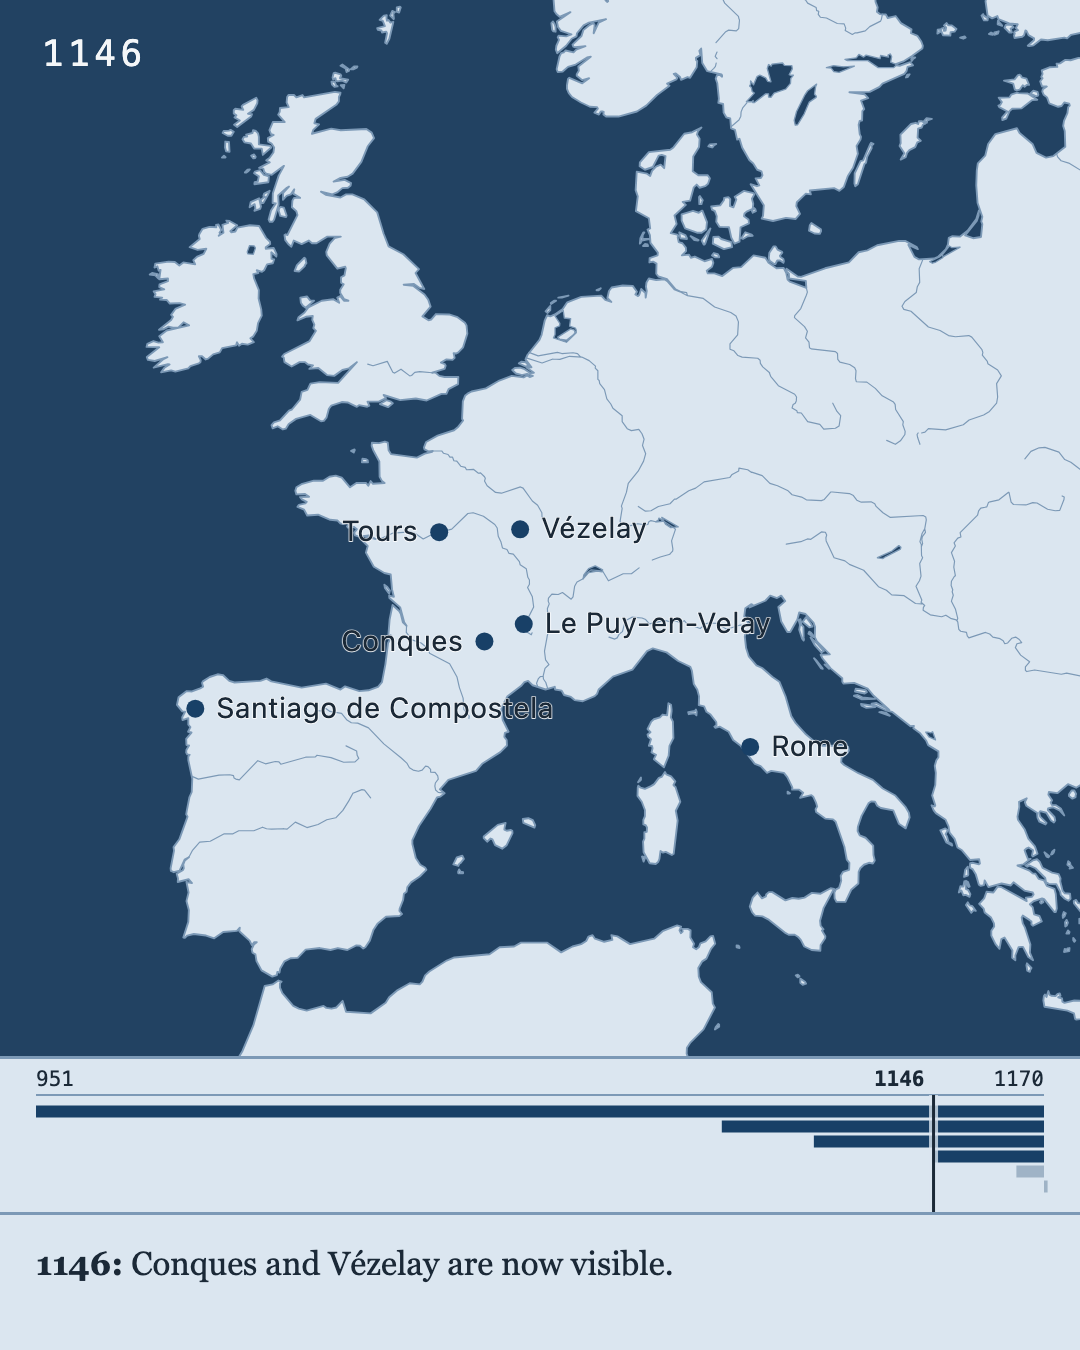
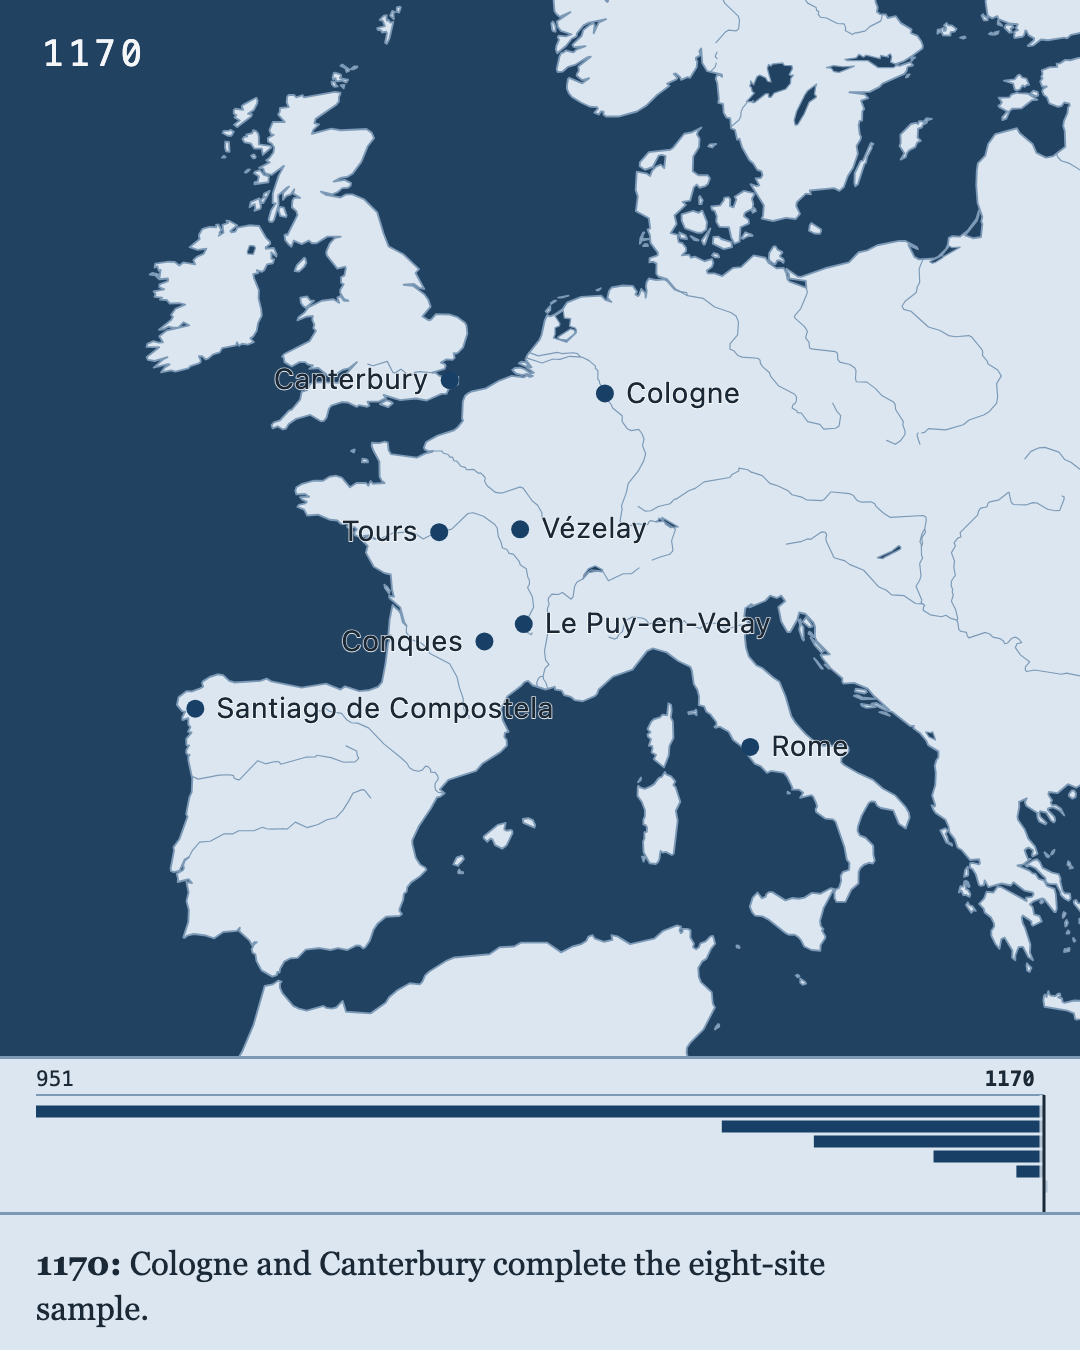
Four numbered PNGs, each 1080 × 1350 pixels. To make your own, open Years & captions, choose your years, and select each year to write its caption. Then export an Image series with the Portrait shape. Open the project in Marches to try it, or follow the timeline instructions.
Press Play to move through time
Play the four selected years, change the speed, or use the year slider. Click a place to read its sample source. You can pan and zoom, too.
The downloaded HTML works offline in a browser. This is an interactive map, not a video file. Open the project file in Marches to change the years, colors, or labels.
Sources and scope: pilgrimage sample
The pilgrimage sample contains eight European sites, with approximate modern coordinates and illustrative dates and source notes. A dated place appears from its stated year onward; undated places remain visible. The years mark selected events in the sample, not the founding of each site or a complete history of pilgrimage. Coastlines are modern.
A map that fits the post
Five image shapes for social posts, shown here in the Ensign palette. In Marches, choose Export → Image shape to preview the fit and pick your size. The geography expands to fill the frame.
These are the default Large PNG sizes. Marches also offers smaller and larger images, plus scalable SVGs. Click any preview to open the full image.